
Star Formation in the Aquila Rift
With colleague Ralph Shuping, I have been investigating the star formation in the W40 cluster and the Aquila Rift region. W40 is an embedded H II region, powered by a handful of late O and early B stars and located at the southwest end of the Aquila Rift. Infrared and X-ray surveys show up to 1,000 members within 20 arcminutes of the central bright sources. Many of these other sources appear to be Class II or III young stellar objects (YSOs), which together suggest an age for the region of less than a few million years. W40 is one of a handful of massive star-forming regions within 1 kiloparsec of the Sun that allow individual sources to be resolved, making it an ideal laboratory for intercomparing source characteristics within a sample of stars with the same age and birth environment.
Previous near-IR surveys have been relatively shallow. We used the UKIDSS Galactic Plane Survey (GPS) Data Release 10 to generate a more complete sample of young stars in the W40 region. The uniform survey depths (about 1–1.5 mags deeper in JHK than previous near-IR surveys of the region) and accessibility of nearby control fields allow us to estimate background contamination.
Wide-field near-IR surveys have been used to find young stars in star-forming regions. However, not correcting for background contamination can lead to significant overestimations of K-band excess sources. We find far fewer Class II and III sources in the W40 field than previous studies, suggesting that the star formation rate and efficiency across the W40 field may be lower than previously thought. Stellar density maps of the W40 region that have an estimated background density map subtracted show the W40 cluster clearly but also additional groupings of excess sources. They coincide with regions of relatively lower extinction, which suggests that they are on the far side of the W40 cloud complex but still related to W40.
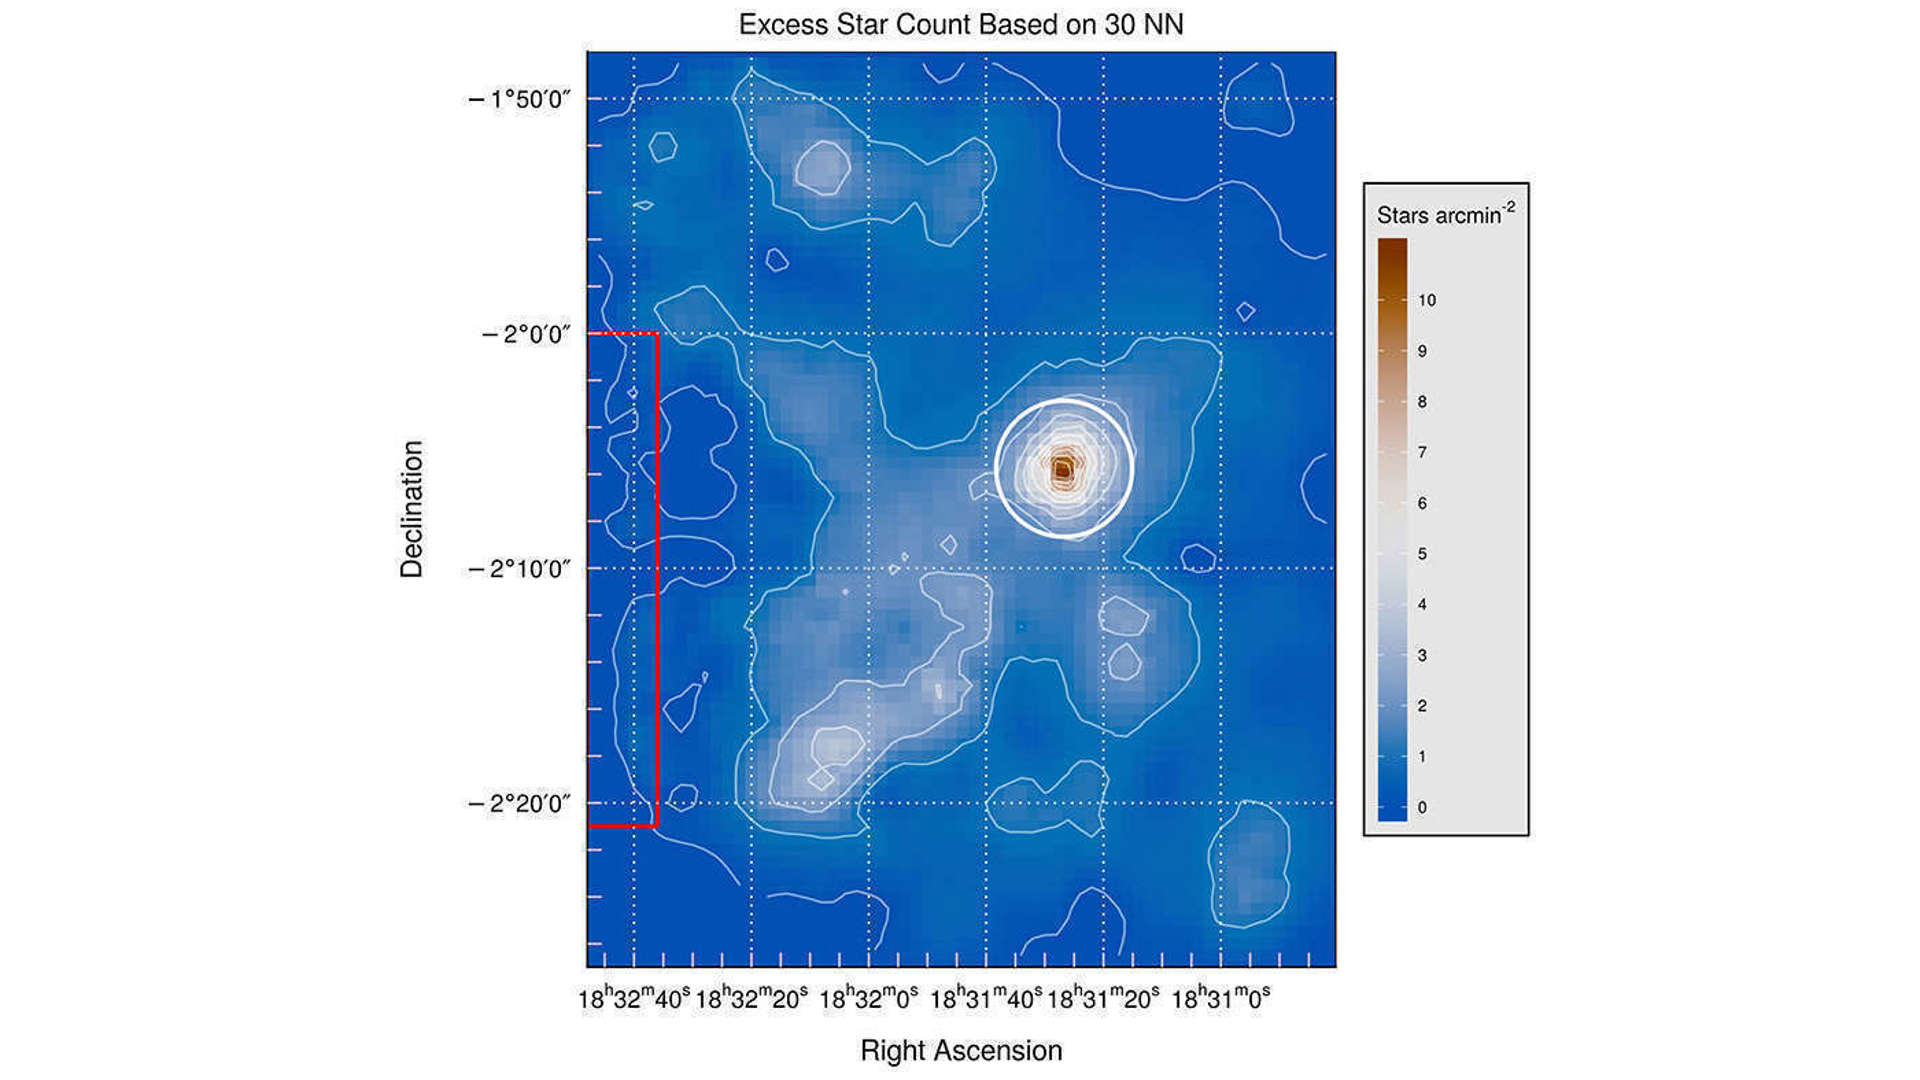
Excess Star Count Based on 30NN
The W40 field star density map created from a j=30 Nearest Neighbor algorithm shows excess stars above background, after having a normalized and rescaled off-source stellar density map subtracted. The contours denote densities of 0, 1, 2, ... stars arcmin-2. The red box shows a strip of low extinction along the eastern edge of the field, which was used to rescaled the off-source star density map.
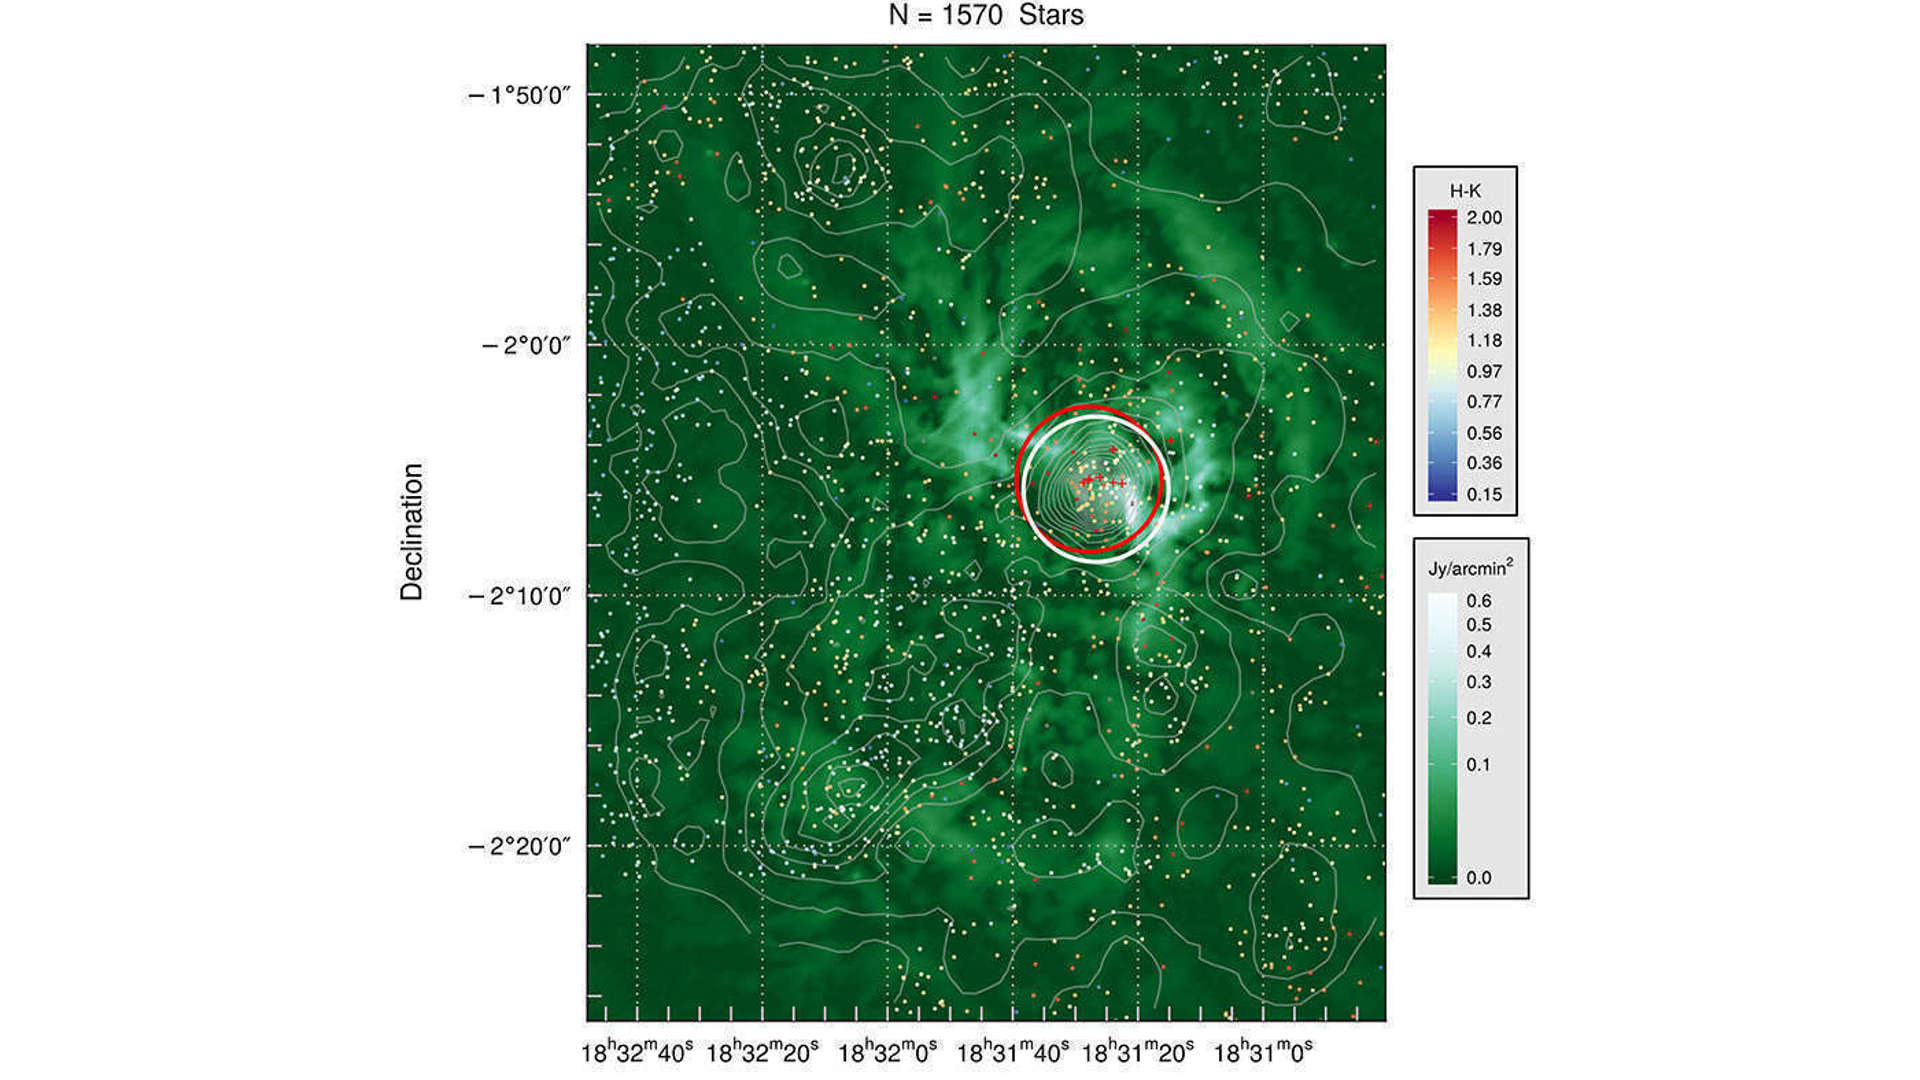
W40 UKIDSS GPS H-K
Stars with K-band excess plotted as points in the W40 field with colors representing H-K colors, against a backdrop of the Herschel PACS 160 μm emission.
Overlaid are contours from the j=30 Nearest Neighbor analysis of the K-band excess stars representing stellar clumping minus a normalized and rescaled background density map, with contour levels in 0.5, 1.0, 1.5, 2.0, ... stars arcmin-2. The slight over-density of K-band excess stars to the southeast, northeast, and south of the W40 cluster is evident from the stellar density contours. Locations of some of these excess stars appear to be slightly anticorrelated with the bright dust emission.
References
Yu, K. C., and R. Shuping. 2019. The W40 cluster region with the UKIDSS Galactic Plane Survey and Gaia. In preparation.
Yu, K. C., and R. Shuping. 2018. Characterizing the W40 cluster region with the UKIDSS Galactic Plane Survey. American Astronomical Society Meeting #231, Bulletin of the American Astronomical Society 448.04.
Shuping, R. Y., W. D. Vacca, M. Kassis, and K. C. Yu. 2012. Spectral classification of the brightest objects in the galactic star-forming region W40. The Astronomical Journal 144(4):116–127.